Drawings often include notations such as “25 g6” or “17.5 H11/g8” to specify tolerances. These are called “Engineering fits and tolerances” and are listed in long, confusing charts. Navigating those tables and understanding the nuances can be intimidating, but we will clarify it all in this article.
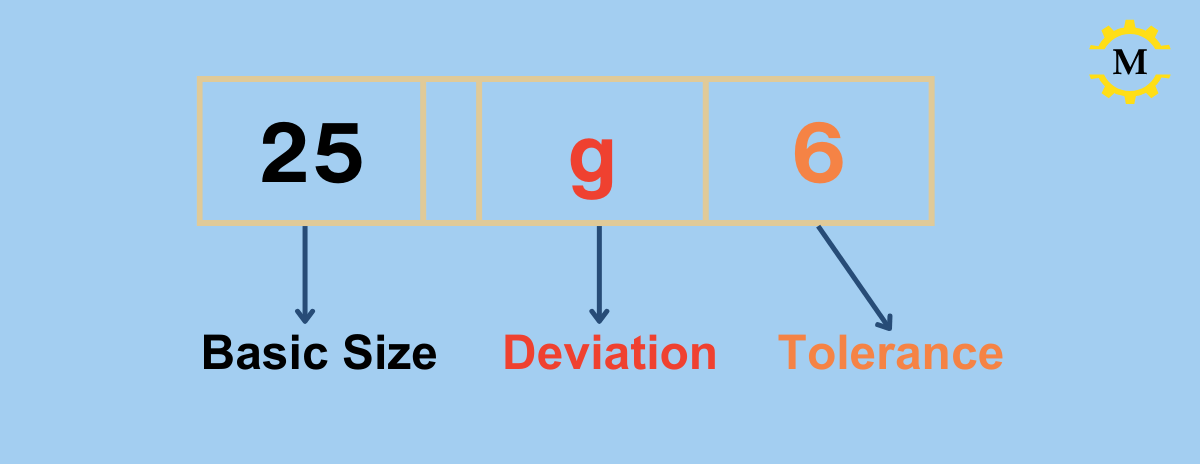
Before we proceed, it’s crucial to learn the three fundamental terms in the notation shown in Image #1.
The Basic size (Also called nominal size) is the dimension by which a feature is identified for convenience. It’s also the point from which the limits are derived by applying data from the charts. For example, a square shank of a cutting tool with a height of 24.8 millimeters would be known as a 25-mm shank since its basic size is 25 mm.
In the above definition, we used the term “feature” – we should clarify it before moving on. In our context, a feature can be either a shaft or a hole.
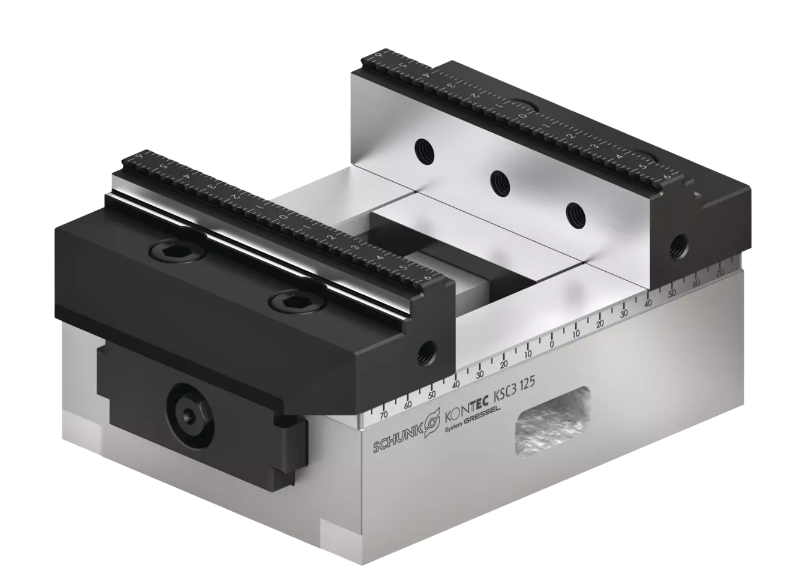
A Shaft refers to an external feature of a workpiece, typically cylindrical in shape. However, the term can be used to describe any external feature. For example, a block that has to fit into a keyway or the square shank of a cutting tool can also be referred to as a shafts.
A hole refers to an internal feature of a workpiece, typically a bore. However, the term can be used to describe any internal feature. For example, a keyway.
Referring again to image #1, the basic size is followed by a 1-2 letter code denoting the “deviation”. Holes are marked by capital letters and shafts by small letters. For example, “G” is a deviation of a hole, and “js” is a deviation of a shaft.
The deviation defines the position of the tolerance zone relative to the basic size. The algebraic difference between the upper limit and the basic size is called the upper deviation and is denoted by es for shafts and ES for holes. The algebraic difference between the lower limit and the basic size is called the lower deviation and is represented by ei for shafts and EI for holes. The configurations may be confusing and depend on whether the feature is external or internal and if the deviation is negative, positive, or zero (See image #2).
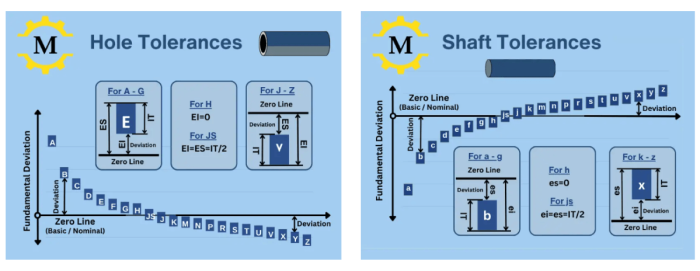
Coming back to image #1, the deviation is followed by a number between 0-10, representing the tolerance grade (Denoted by “IT”). A smaller number means a narrower tolerance field.
The key point here is that deviation describes how far a feature is from the nominal size and how loose or tight it will be when assembled. It does not affect the precision of the feature or the difficulty of manufacturing it. On the other hand, the tolerance grade describes the precision of the feature and its uniformity when manufacturing a series (but does not affect its assembly).
Let’s now see how to obtain the upper and lower limits of 25g6.
The easiest way is to head over to an Online Tolerance Calculator, plug in the numbers, and get the result. However, to better understand the terms described in the article, we will use the conventional method and extract the data from the charts in ISO 286-1.
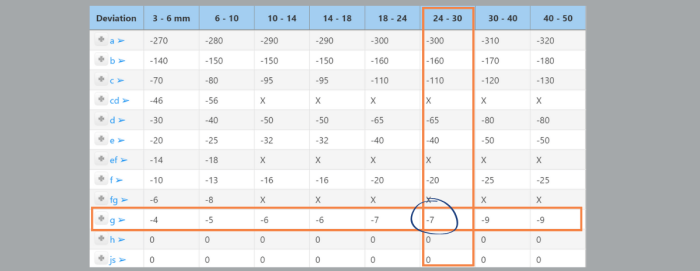
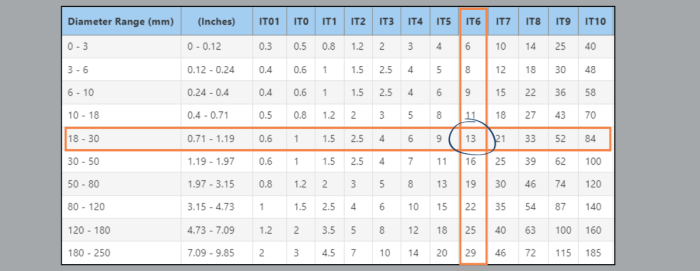
We will start by going to the first table (Table #1 below) and obtain the tolerance grade 6, for diameter 25 mm. We have to find the row for the basic size of 25 millimeters and the column for IT6. As you can see, the tolerance value in this case is 13 microns.
Next, we find the table listing the deviation for “g” (Table #2 below). We need to find the row for 25 millimeters and the column for the deviation “g”, which yields minus 7 microns. The upper limit is calculated by 25-0.007=24.993, and the lower limit is the upper limit minus the tolerance; hence, 24.993-0.013=24.98. The calculation is tricky since it depends on the configuration of the element. You can see the formulas for different configurations in image #2.